
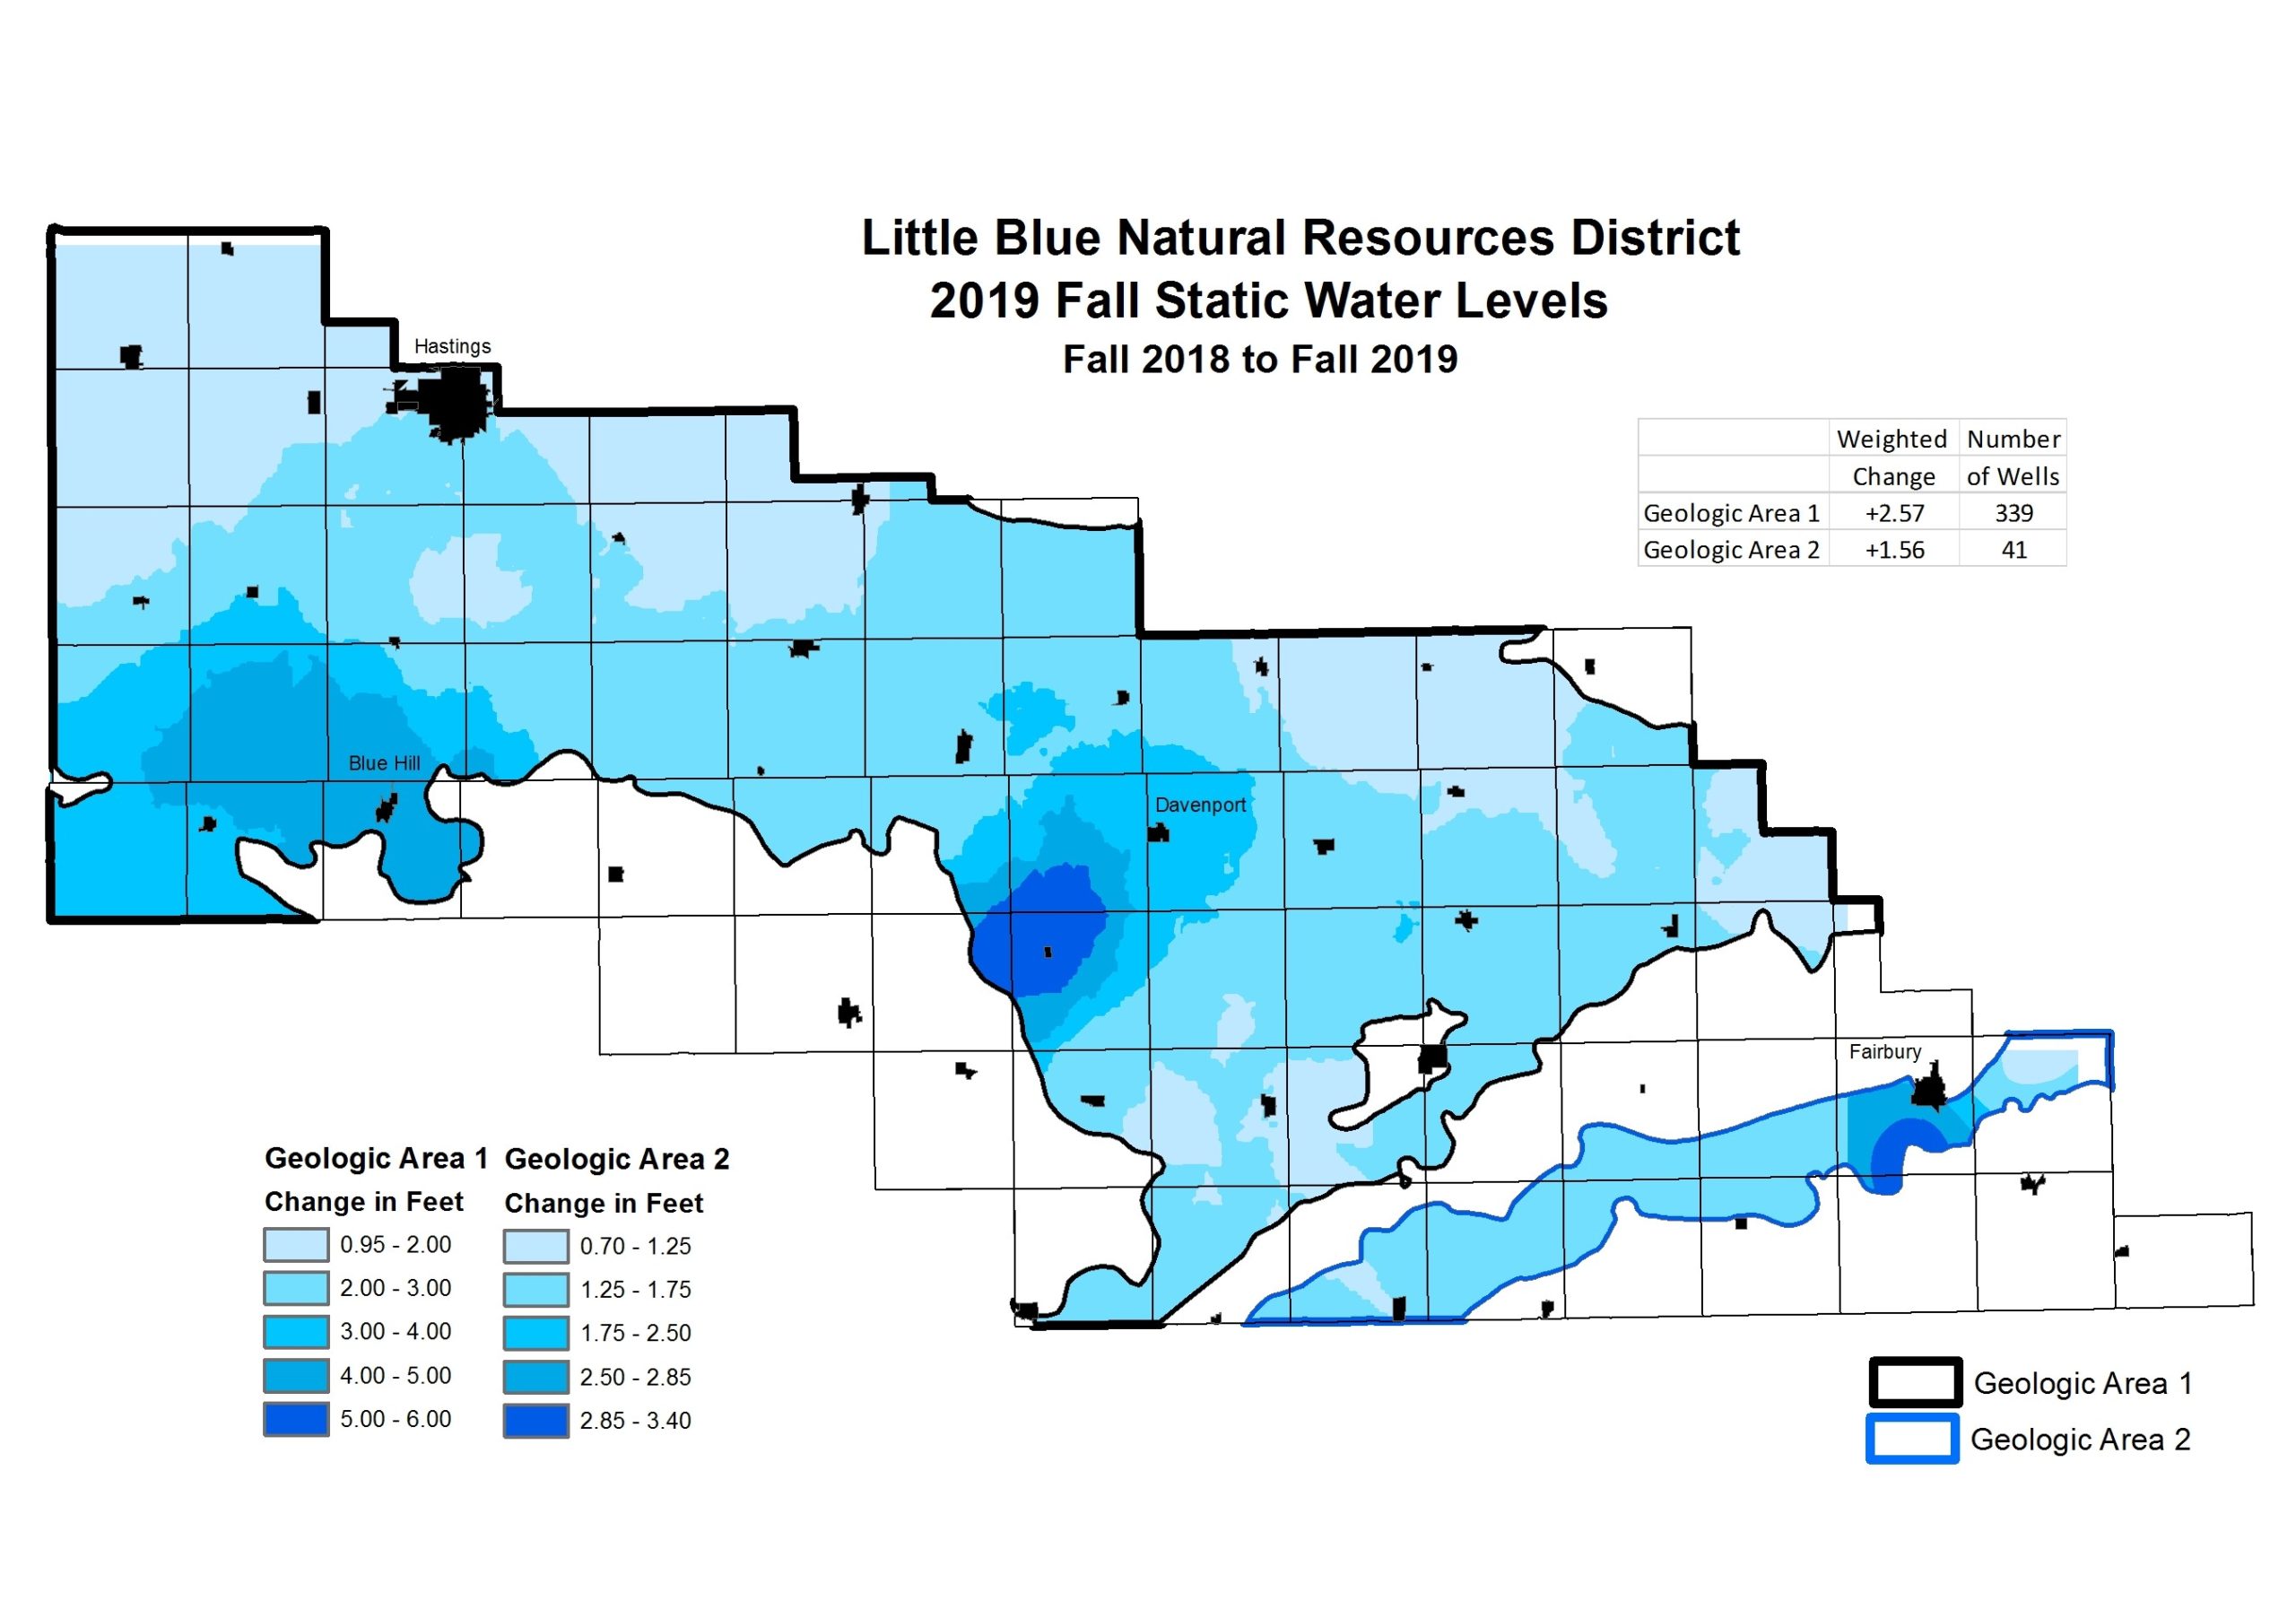
Last year the fall colored water level map had changes that ranged from declines shown in red, and rises shown in blue. This fall there was difficulty finding enough differing shades of blue to depict the water table rises across the district! On the change map the weighted average rise for Geologic Unit 1 was +2.57, for Geologic Unit 2 the change was a +1.56. This is the 2nd largest fall rise, the District averaged an increase of +3.20 feet from the fall of 1992 to 1993. However; the District wasn’t using weighted average change or differing geologic areas then.
The darker shades of blue on the map had water level rises of 5 to 6 feet in Unit 1; 2 to 3 feet in Unit 2. The District doesn’t graph fall water level changes, only the spring levels are used for regulatory purposes based on a weighted average graph.
Staff wouldn’t expect to see a 2½ feet rise in the spring water table because seeps and springs are common, and some groundwater will discharge back as stream flow over the winter. USGS records the Little Blue River’s flow at Hollenberg on November 4th at 370 cfs. The median for that date for the last 44 years is 148 cfs so there is most definitely a surplus of water in the system right now. The surplus of rainfall received this summer and reduced demand on the aquifer will very likely make a positive change for spring levels in 2020.