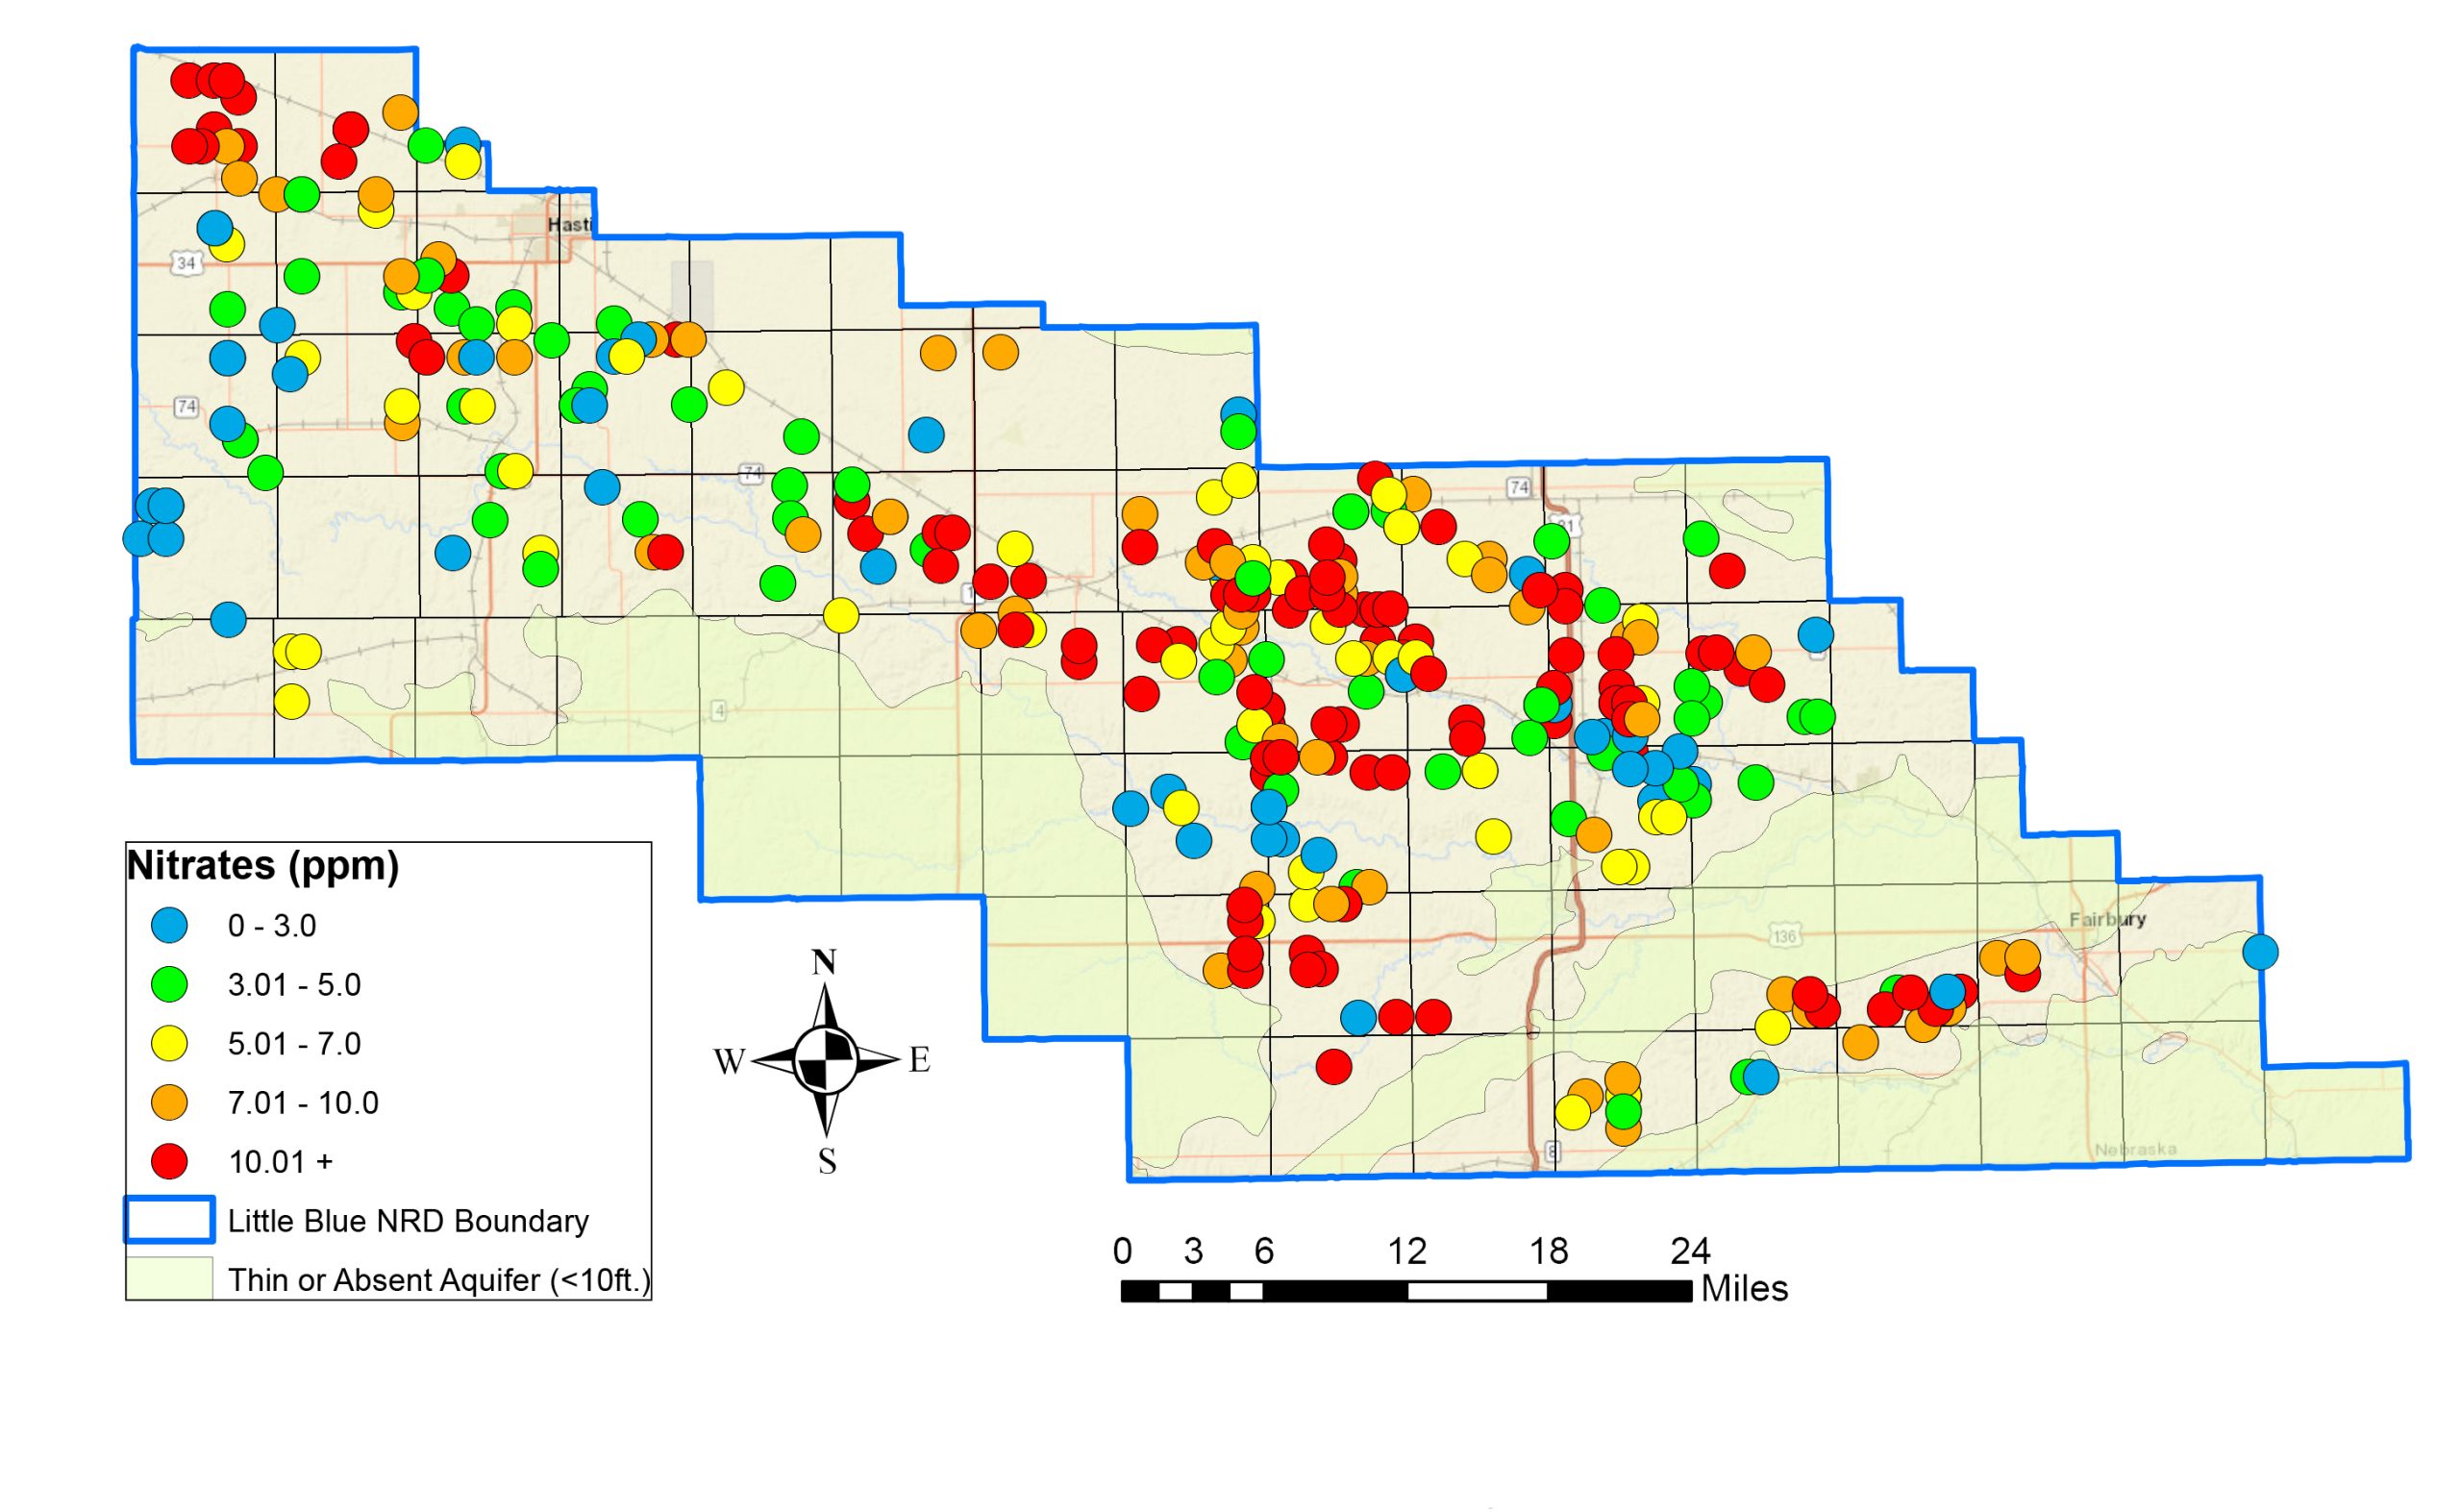
The Little Blue Natural Resources District (LBNRD) took 325 water samples from irrigation wells this past summer.
If one of your wells was one that was tested, you received a postcard from us telling you your well’s nitrate result and how to figure out the nitrogen credit associated with it.
Nitrates are down from the previous year in almost all of the LBNRD which is great to see. Average nitrates within water quality sub-areas came in at 10.6 parts per million (ppm), still above the EPA’s maximum contaminant level (MCL) of 10 ppm, but down 0.6 ppm from a year ago. Average nitrates outside of water quality sub-areas were 5.7 ppm, up slightly from a year ago. While it’s great to see a slight tick down this year in areas with historically high nitrates, long-term trends are still rising.
Nitrates in Nebraska’s groundwater are a serious issue facing our state. Nitrates are responsible for higher rates of the blue baby syndrome and have been correlated to higher rates of various cancers, also, making elevated nitrates a significant public health issue.
Primary sources of nitrates in groundwater are nitrogen fertilizers and animal manure. The best way a farmer can reduce nitrates in groundwater is to apply nitrogen fertilizers when the crop is able to take up the excess nutrients, and in the right amount, only giving the plant what it needs, not more or less.
If you have any further questions, comments, or would like more information regarding nitrates in drinking water, please contact me at tgoeschel@littlebluenrd.org, or call me at 402-984-3131.
| Sub- Area | Nitrates Average (ppm) |
| Bruning | 13.1 |
| Carleton/Davenport/Ruskin | 10.3 |
| Clay/Nuckolls | 10.1 |
| Deshler/Broyn/Ruskin | 11.6 |
| Fairbury | 9.4 |
| Hastings | 6.5 |
| Kennesaw/Prosser | 14.1 |
| Superior/Hardy | 10.3 |

