Spring 2021 Water Levels
Spring water levels were completed this month. Geologic Area 1 was up 0.49 feet, Geologic Area 2 up 0.28 feet. Area 1 was up 0.44 last fall and that carried through to this spring; Area 2, the paleo-valley aquifer from Chester to Fairbury, was up 0.81 in the fall of 20 but levels didn’t stay strong through the winter. Please refer to the attached graphs and map for this information. The weighted average graphs show that rise from ’20 to ’21 for both areas, but this has leveled off some from the big jump in the spring of 2020. The spring water level changes for each well are depicted on the back of the weighted average graphs, there are some distinctive changes from west to east across the district. Mostly all red and yellow declines in Adams, Webster, and Clay counties. With green and blue rises in Thayer, Fillmore, and Jefferson. But how bad are the declines out west? In 2019 and 2020 that area was having rises, so 2021 is still above the lows recorded in 2017. The spring levels from 2 of the measured wells in 5N-12W and 6N-11W show that. (Graphs on top row)
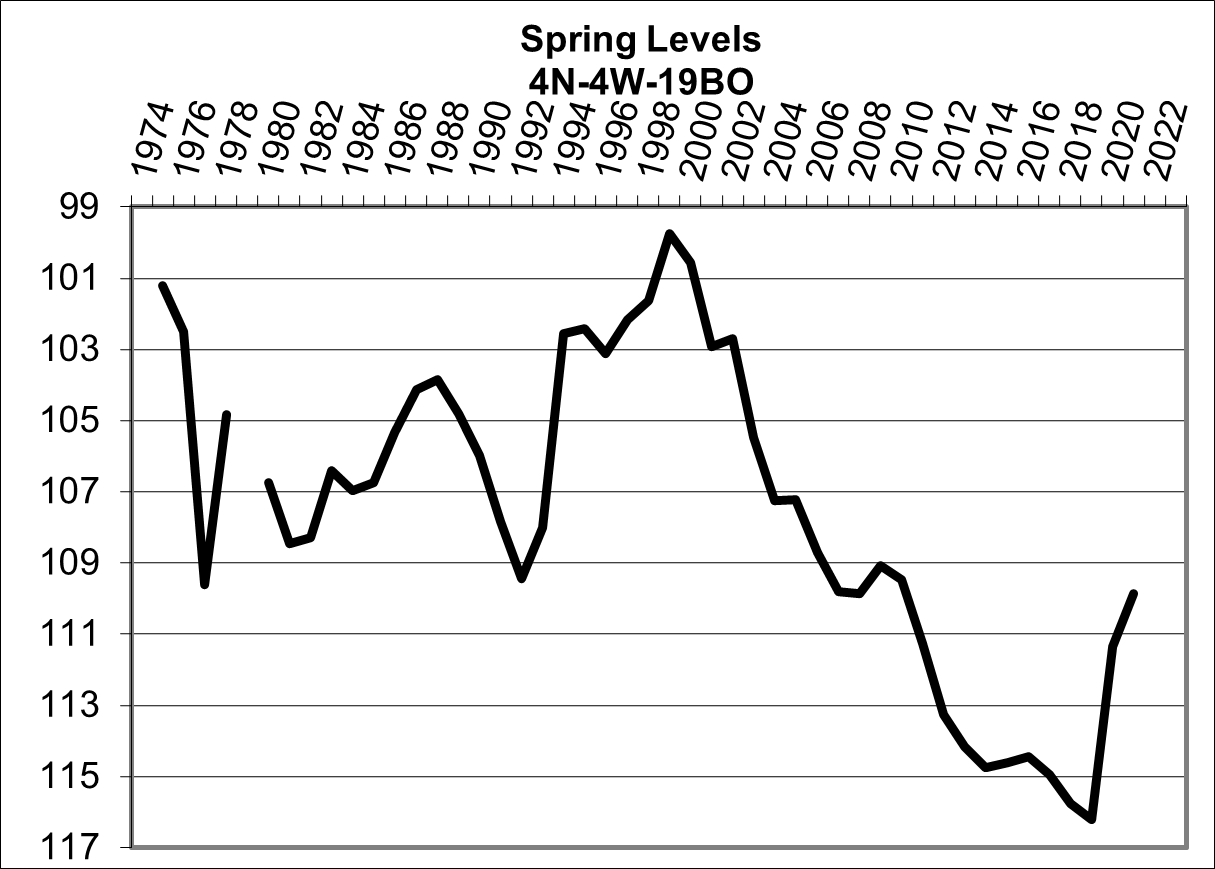
On the other end of the District are graphs from 4N-4W and 3N-4W. Both graphs continue to rise through 2021. All 4 graphs are very similar over time from 1974. The 2 feet of rises and or declines in 2021 really don’t show up much on the individual graphs.
The Base Line the District uses to track levels is 2016. So, the Spring of 2021 is above that level, on both the weighted average and individual graphs, by 2 to 3 feet.
The 2 wells in the top row are in western Adams County, they have been measured since 1974. The spring 2021 declines on the colored map are represented on the graphs in the box. The 2 graphs on the bottom row, above, are in Thayer county, again the spring 2021 levels are represented in the box.

The shaded areas show irrigation use was in the 9-to-13-inch range in 2020 in Adams, Webster, and Clay counties; some rainfall stations reported only 9 to 14 inches of annual rainfall (above). The declines in the spring 2021 water table are likely attributable to these factors, where the yellow and red locations were declines ranging from 0 to -2.75 feet (below).

Irrigation use was in the 9-to-13-inch range in 2020 in Adams and Clay counties. Some rainfall stations reported only 9 to 14 inches or rainfall last year. The declines in the spring 2021 water table are likely attributed to this.


