The District is now using a weighted, rather than a straight line, average for recording spring and fall water levels. This method uses a mapping program to create a measured polygon shape around each well and multiplying the change in depth for the well within that polygon to the geographic area represented. The values derived for each well are then summed and divided by the total acres within all the polygons. Spring levels for two different aquifers within the District are then depicted by graphing the annual change. Any quantity controls are based on the spring levels and are measured by declines from the 2016 level.
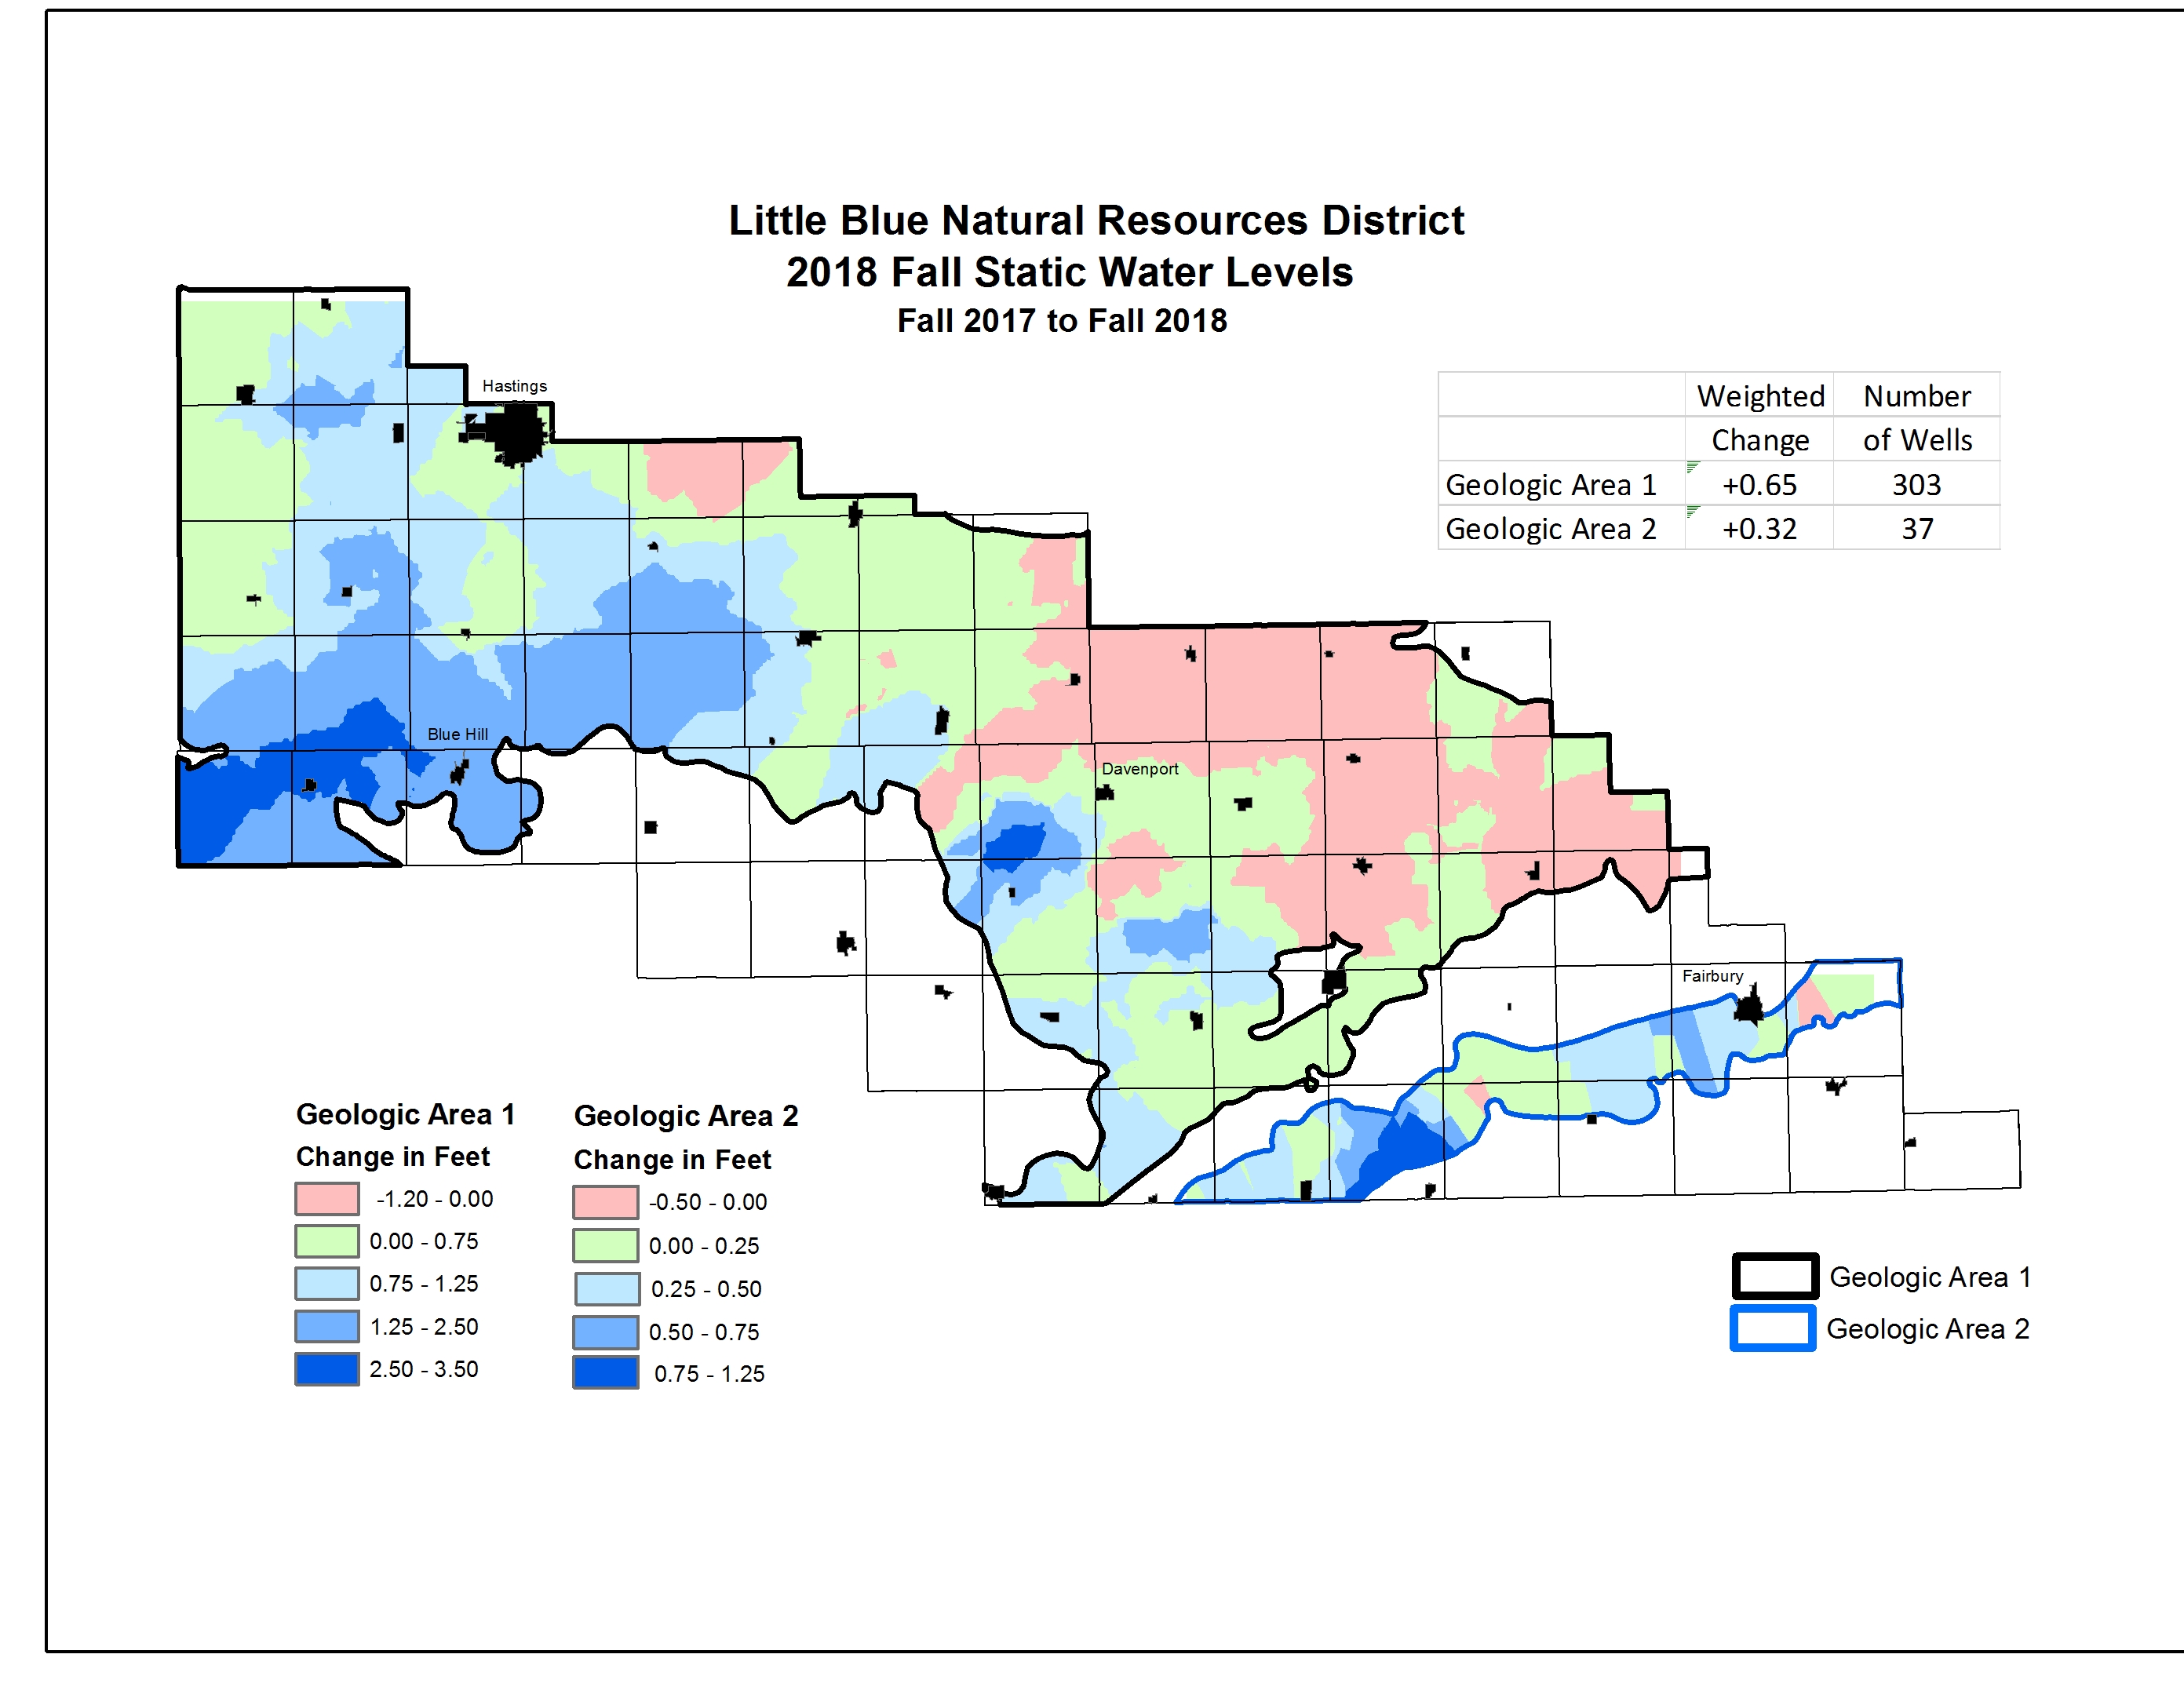
Fall levels are not graphed, but the weighted average change for the fall of 2018, as compared to 2017, was a rise of 0.65 of a foot for Geologic Area 1. Geologic Area 2 showed a rise of 0.32 of a foot.
As the township map the District generally created to show water level changes from year to year wouldn’t depict a weighted change, the colored change map will now be used. This uses a geostatistical method found in ArcMap’s ERSI that assigns weights to values at existing data points based on a spatial pattern and then estimates a best-fit surface depiction. The surface is estimated and does not necessarily pass exactly through the data points but seeks to best fit values for a pattern of change in the data collected.
The color ramps are the same for both geologic areas, but please note the difference in scale between each. Geologic Area 1 had a larger variation of water levels than Area 2, from a decline of -1.2 feet to a rise of 3.50 feet. Area 2’s variation was only a decline of -0.50 feet to a rise of 1.25 feet. The 86 wells in Geologic Area 1 that had a decline were concentrated in Fillmore County and northwestern Thayer. In Area 2 the 8 wells that had declines were generally east of Fairbury.
Fall levels are interesting, showing areas where lack of rainfall for the year likely led to increased groundwater pumping for irrigation. The rise isn’t large for either area, but cautiously shows potential for a neutral or positive change in spring levels.