
Spring Static Water Levels Up in Little Blue NRD
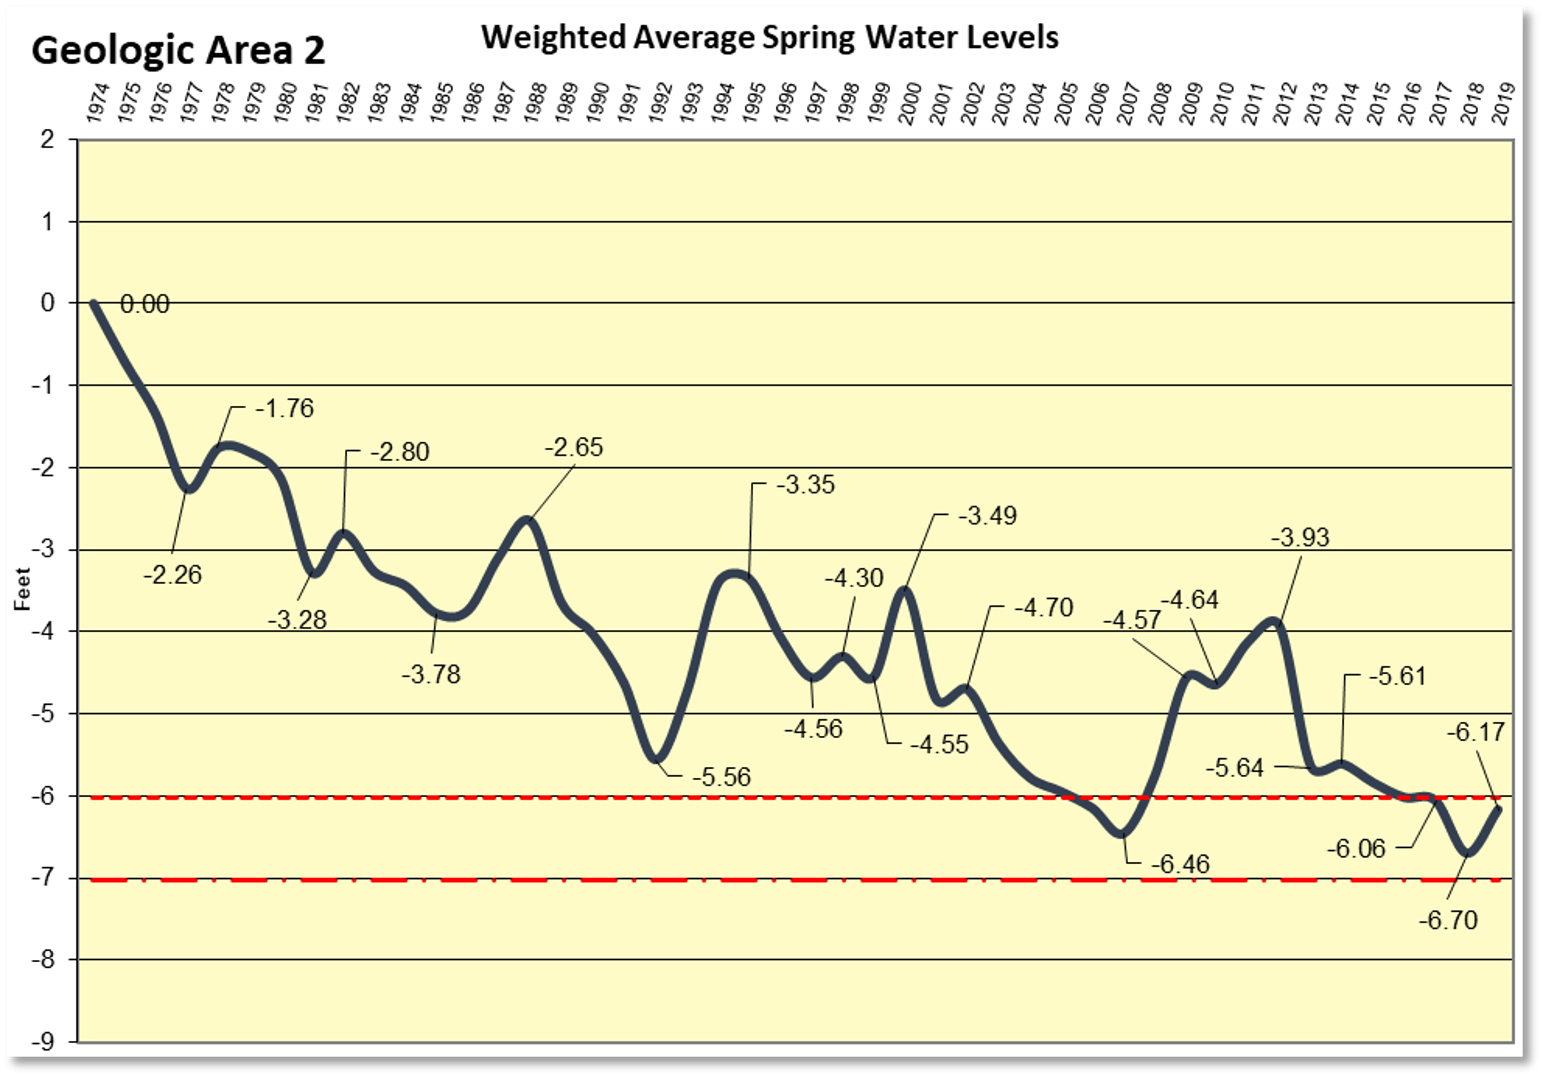
In the spring of 2018, Geologic Area 1 was just a few inches from implementing a stay on well drilling and expansion of irrigated acres. Geologic Area 2 has had such a stay in place since 2006. However, 2018 fall levels were up, and fortunately, that did translate into a spring rise in water levels for both areas. Area 1 was up +0.64 of a foot, and Area 2 showed an increase of +0.53 of a foot. These rises are noted as an uptick on the weighted average graphs included on page three of this report. Both areas have nearly recharged to the 2016 Baseline. This baseline was established in the new District Groundwater Rules & Regulations, which were adopted September of last year, to trigger action by the Board to conserve groundwater.

The average District rainfall in 2018 was up from preceding years at 28.91 inches; averages for the previous two years were 26.86 and 25.20 inches. This rainfall influenced how much the irrigation systems were operational in 2018, which did assist with replenishing static water levels this Spring. Looking back at historical rainfall, the District experienced 30.68 inches of rain in 2015. However, in the same year, 8,000 irrigated acres were added from new well permits. That number does not recognize the irrigated acres that were added to fields already watered with existing wells. Even with higher than average precipitation amounts, the groundwater levels weren’t directly affected and still fell over a period of the next four years.
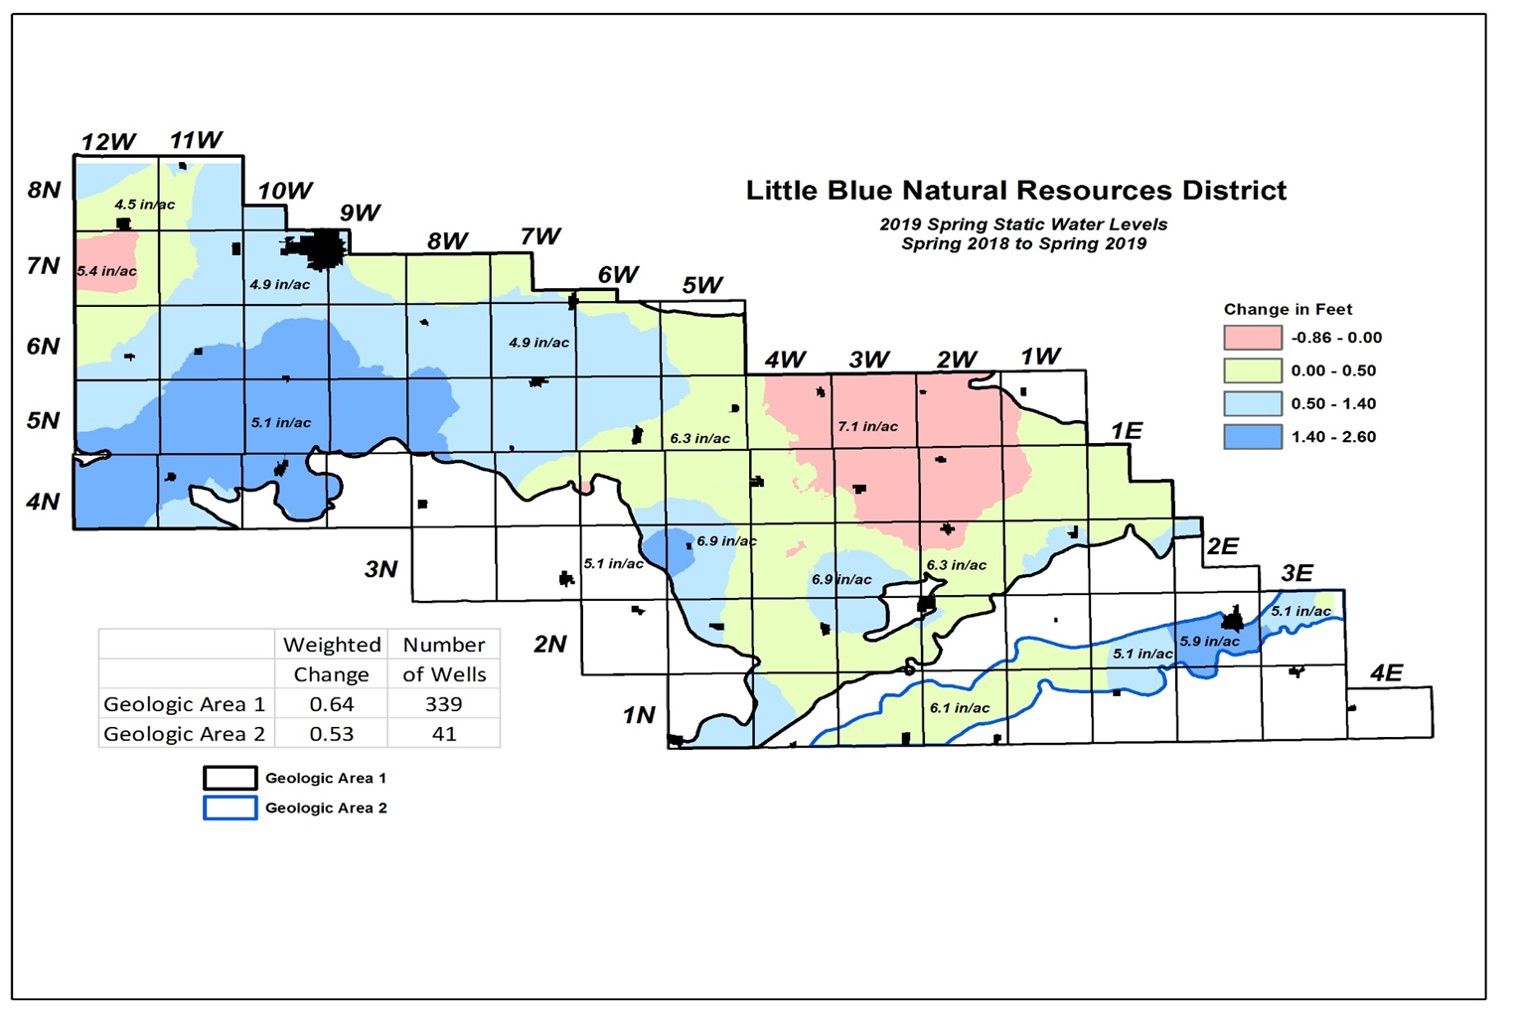
Map 2: “2019 Spring Static Water Levels – Spring 2018 to Spring 2019” (located below) depicts the change in the groundwater table from the spring of 2018 to 2019. The pink zones indicate areas of static water level declines; the green and blues zones represent areas of rising groundwater levels. The pink bullseye shown in 7N-12W is from five monitoring wells; each indicates a fall in water levels from 2018 for unknown reasons. The irrigation water use for all wells in that bullseye averaged 5.4 inches per acre in 2018. When examining the other area of decline exhibited in Fillmore and northern Thayer counties, the average irrigation use was 7.1 inches per acre. The other colored zones on the map are each marked with their average 2018 irrigation use; 5.1, 5.9, 6.1, 4.9, or 6.3 inches per acre.
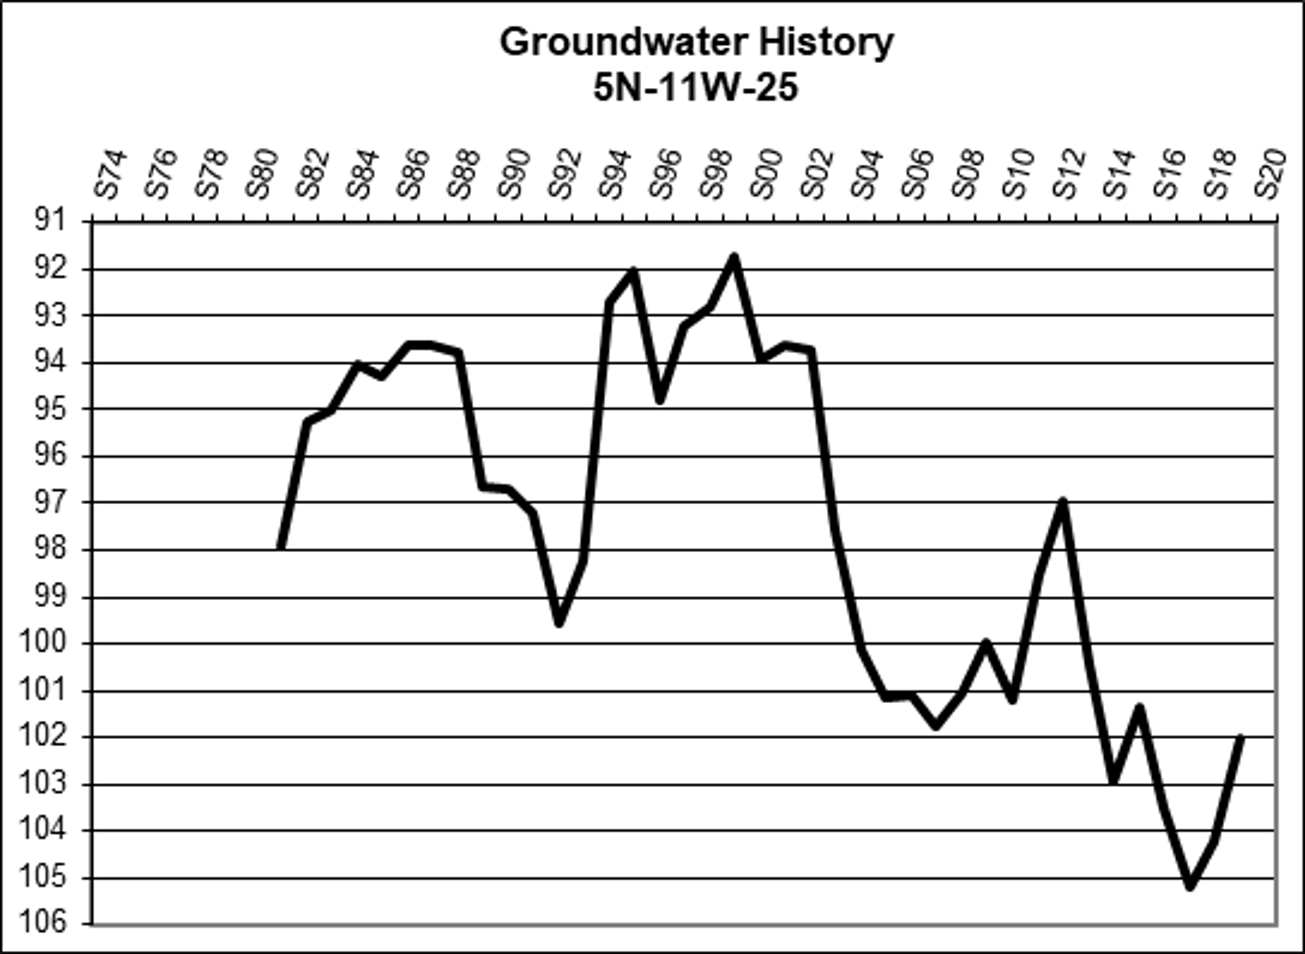
Upon examination of the decline in 5N-11W, data confirms there was a rise in the water table this spring. The graph below represents static water levels measured from a single well every spring since 1980 in Section 25 of that township. The static water level reading in 2019 has experienced quite a bit of recharge but still exhibits a substantial difference from the levels drawn in the late 1990s.
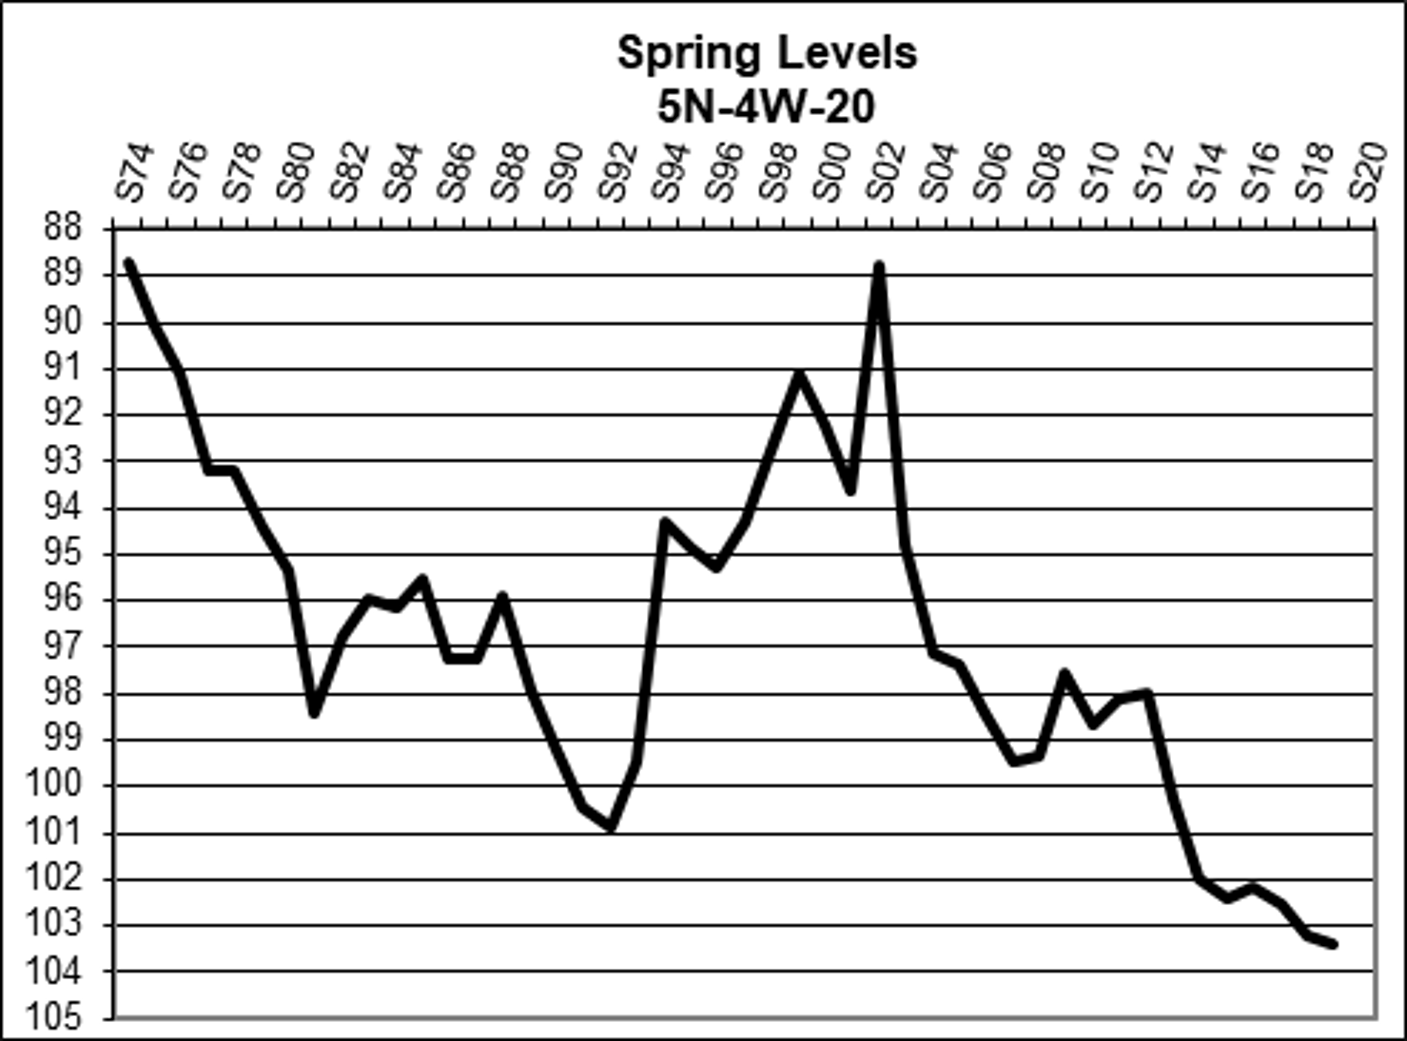
The graph representing a well located in 5N-04W, which lies in Fillmore county, draws very similar conclusions to the weighted average graph for the geologic areas and the well located in 5N-11W; however, this spring it still displayed a slight decline in water levels.
The District’s spring static water level network contains data from all sources: deep wells, valley wells, and those in between. Sites located in the alluvium of a river valley positively influenced the spring readings. There are a couple of dozen alluvial wells which have water levels linked to flows in the rivers and creeks. If you single those wells out, their average rise was +1.88 feet, surpassing the average increase for either Geologic Area.
All evidence concludes there has been a move a positive incline in the water table overall, which is excellent news for everyone. However, we ask that you continue to implement groundwater conservation practices on your operations to ensure the long term health of the District’s groundwater aquifer.