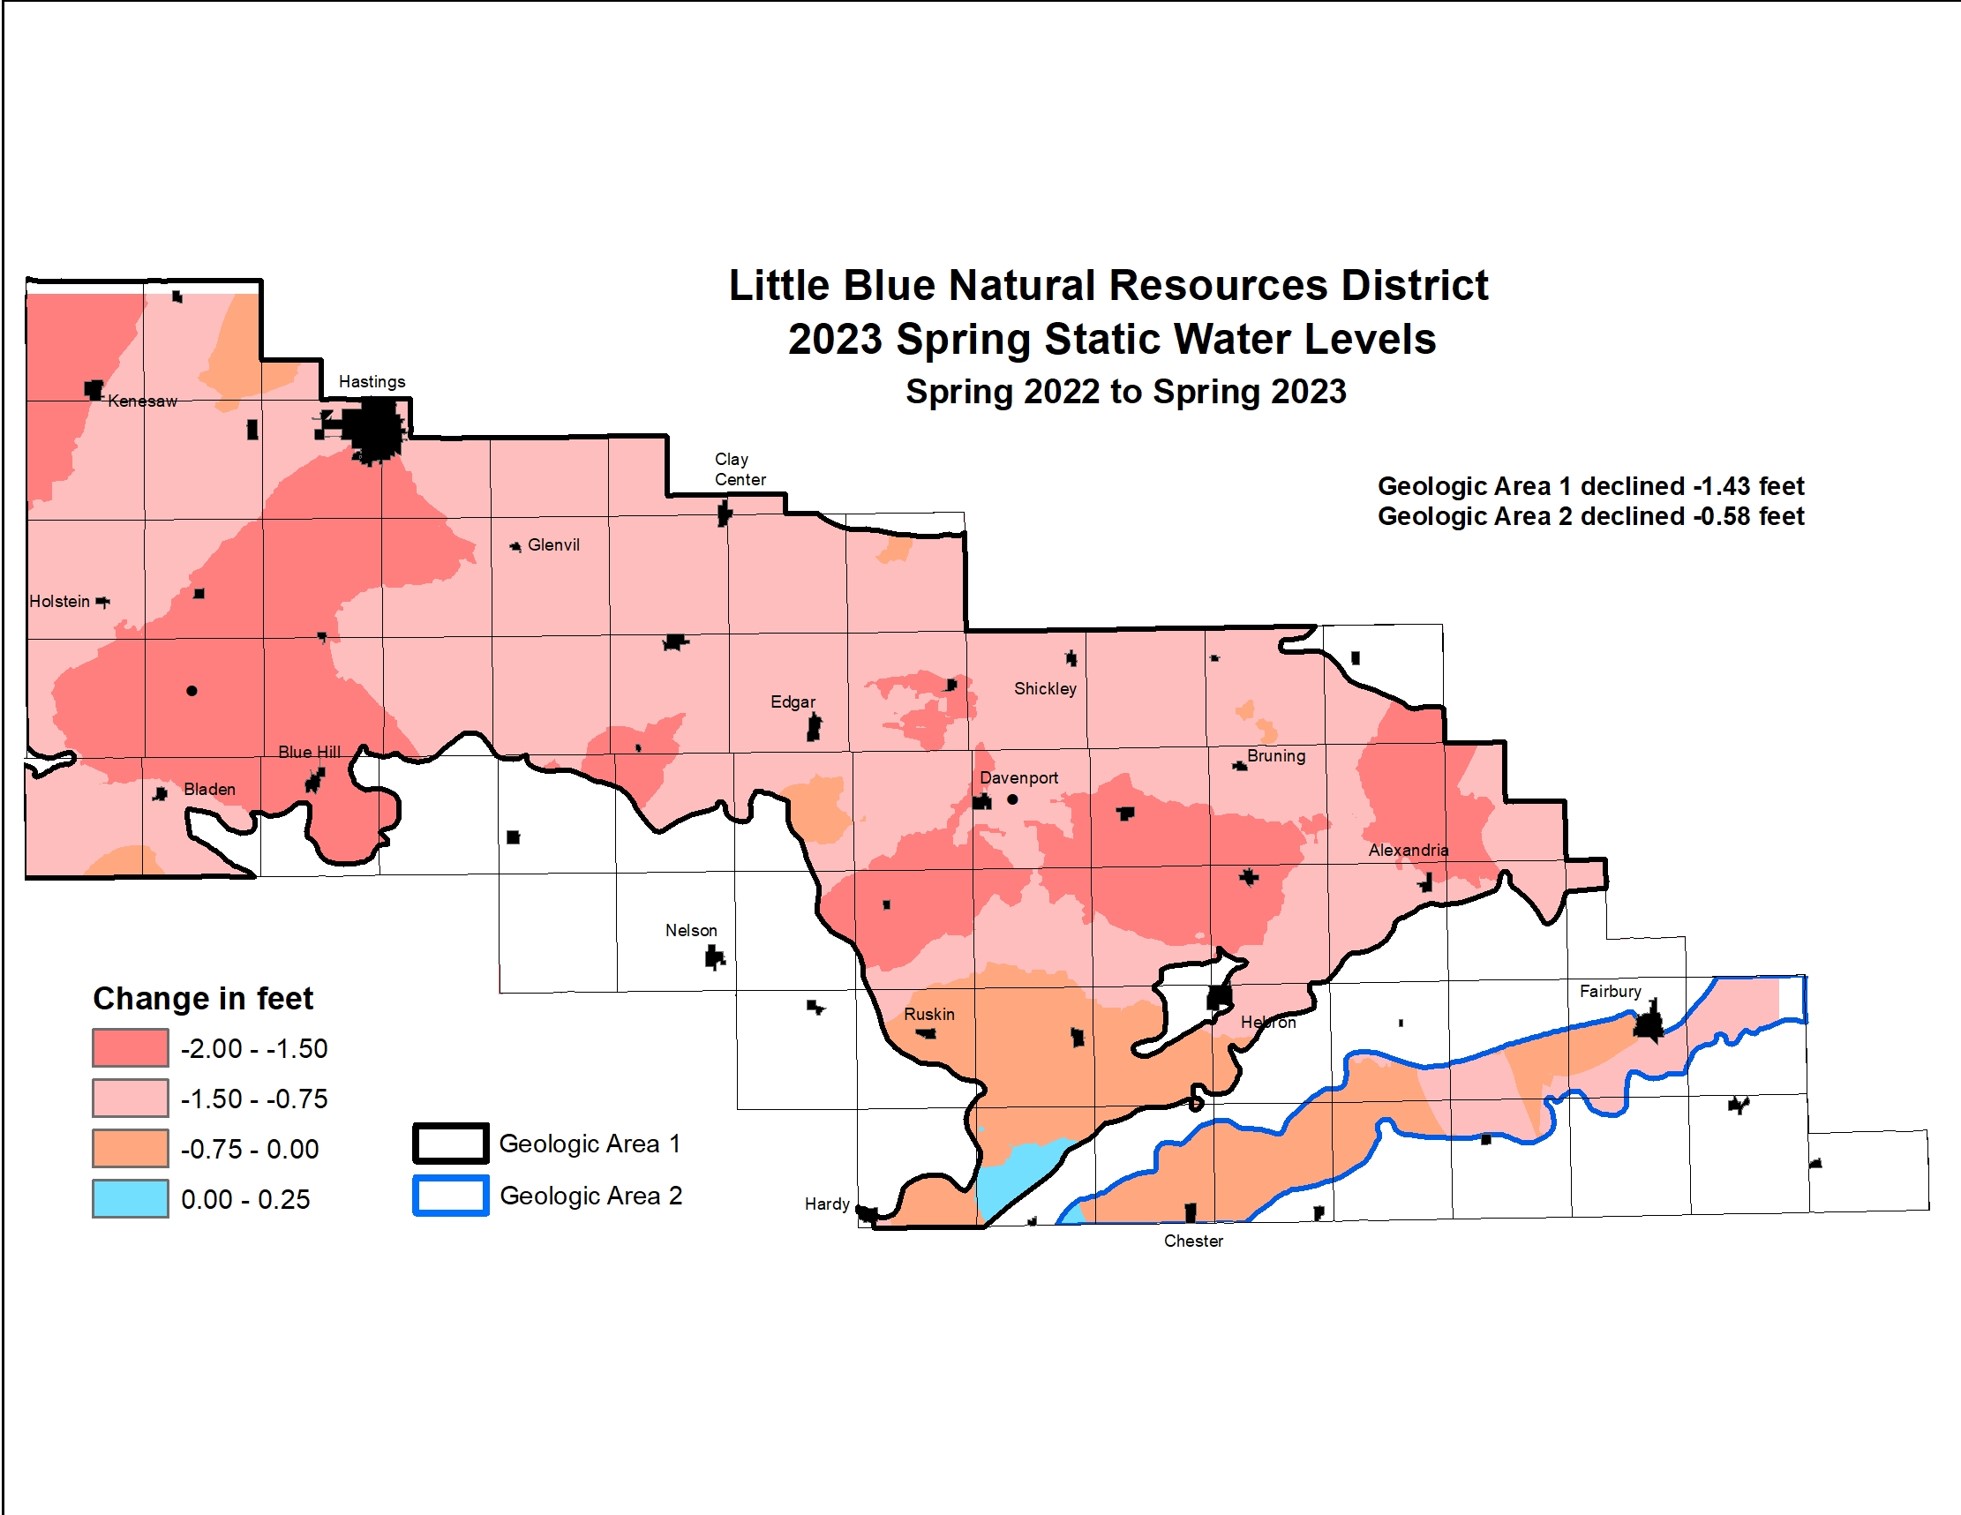
This spring the water levels were completed in the month of April. The map above shows the changes between Spring 2022 and Spring 2023. This map shows a large majority of the District with declines. Geologic Area 1 was down -1.43 feet on average. Some of the hardest hit towns were Kenesaw, Deweese, Ong, Oak, Carleton, Belvidere, the areas between Hastings, Roseland, and Blue Hill. Geologic Area 2 went down -0.58 feet on average. The hardest hit area is around Fairbury and Reynolds. However, there was a small rise around Bryon, unfortunately this is the only area that saw a rise.
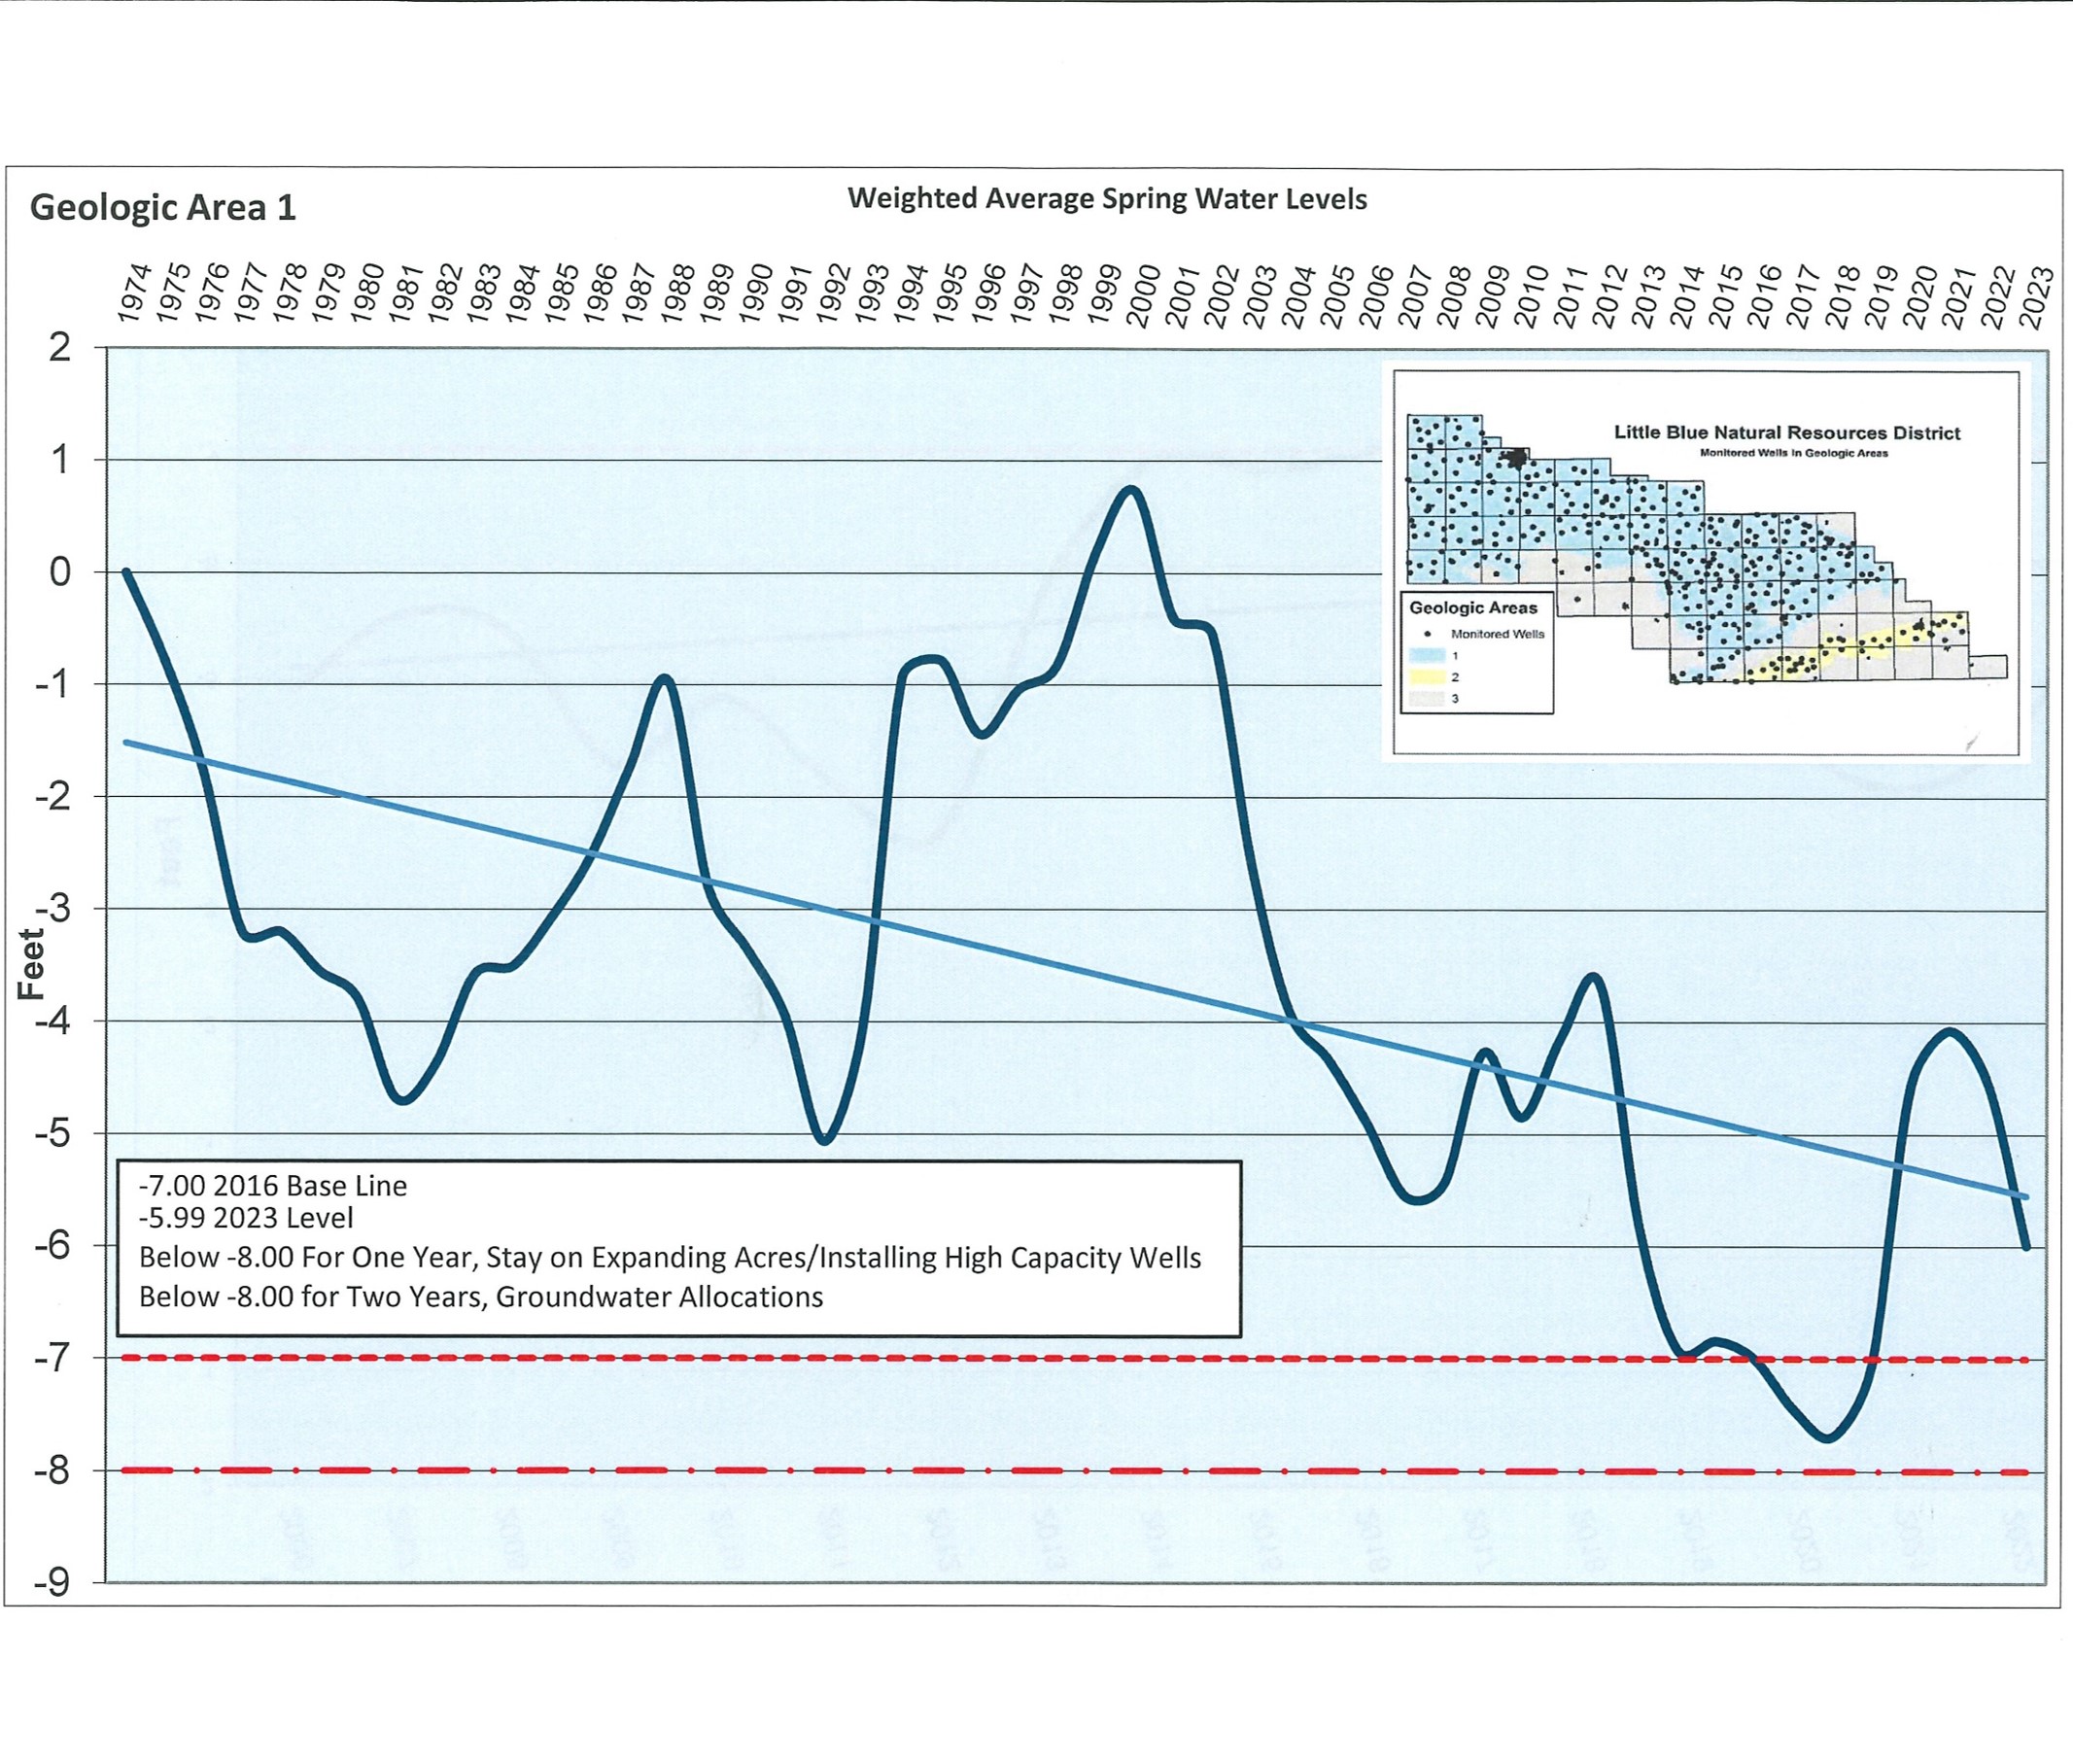
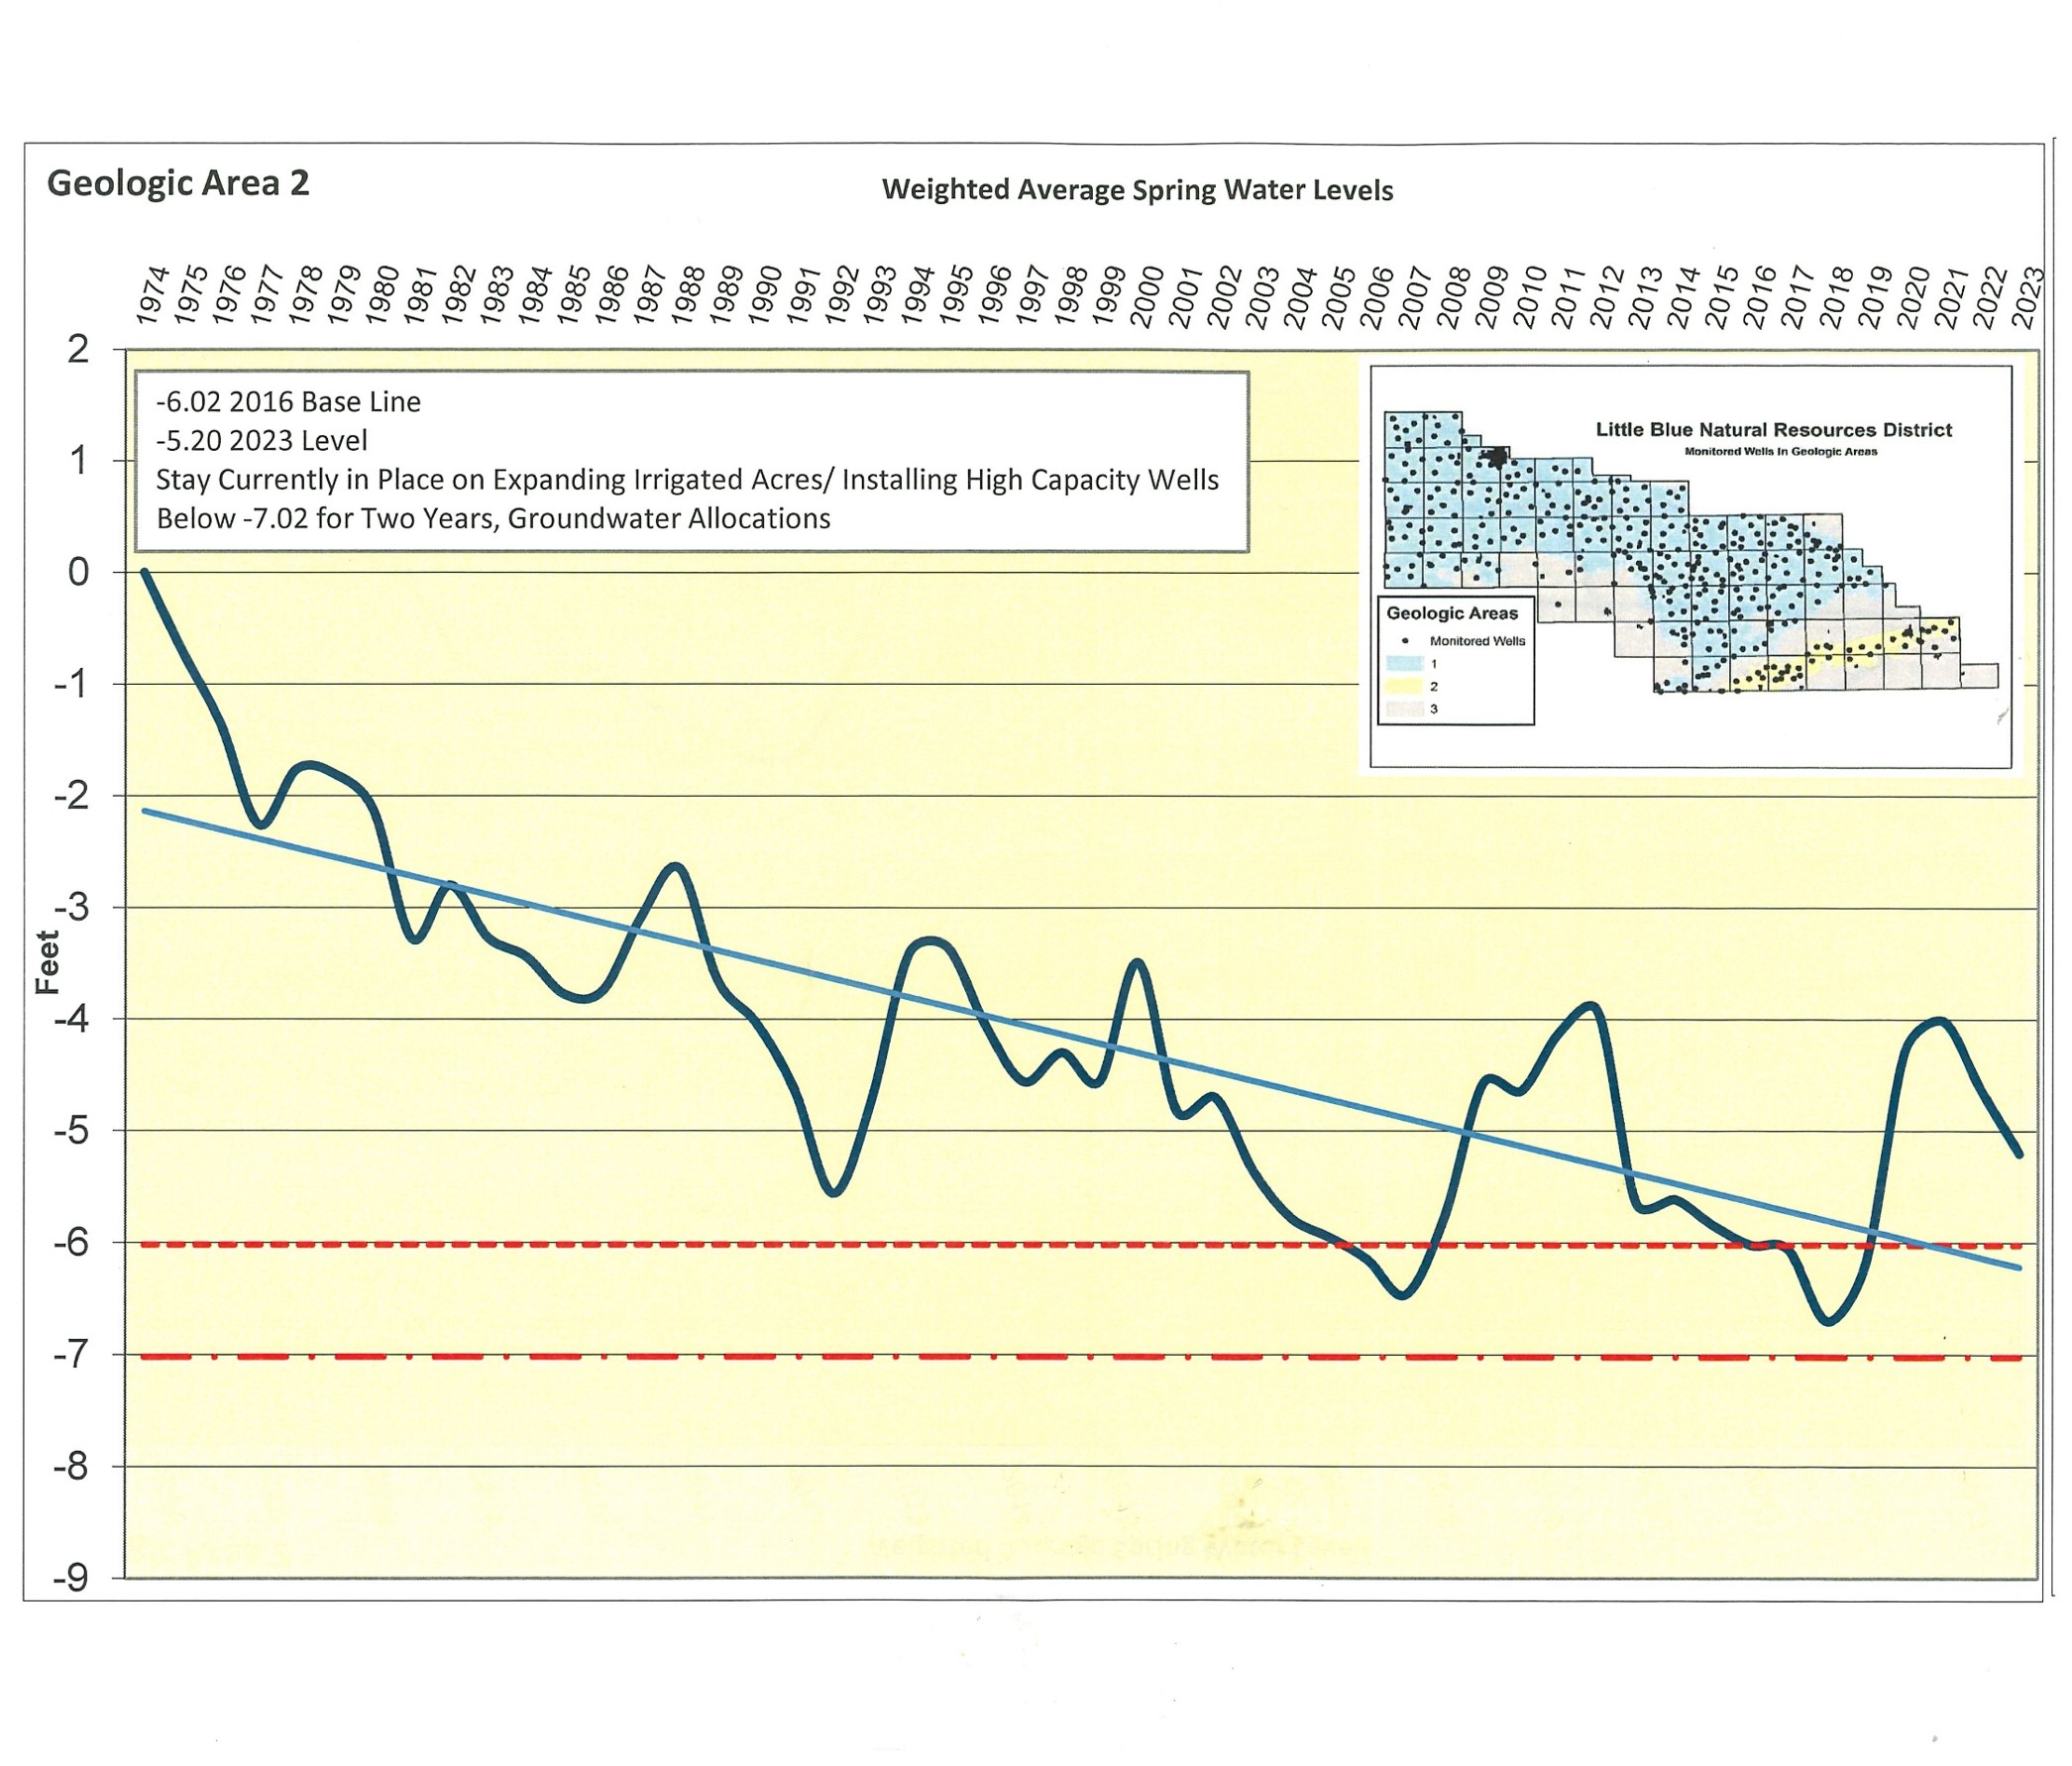
If you look at the weighted average spring water level graphs to the right, you will see we are getting closer to our trigger levels for allocations. In Geologic Area 1, the weighted average is sitting 2.01 feet above the trigger levels. If we drop another -2.01 feet, the Board of Directors will immediately put a Stay on expanding acres and installing high-capacity wells, if the groundwater level remains below that level for a second consecutive year, we will be into groundwater allocations. In Geologic Area 2, the weighted average is sitting 1.82 feet above the trigger levels. If we drop another -1.82 feet, the Board of Directors will immediately a Stay on expanding acres and installing high-capacity wells, if the groundwater level remains below that level for a second consecutive year, we will be into groundwater allocations.
Annual rainfall amounts of 24.25 to 30.23 inches leaves the water table fluctuating between declines and rises of 1 foot. Less than that seems to be a predictable decline while more than 32 inches results in a rise.
This information compares spring of 2022 to spring of 2023 static water levels. Fall 2023 will be collected beginning in October and will compare static water levels to fall of 2022.